The global capital market is increasingly impacted by regulatory changes introduced to the legal system of the European Union and the United States. The overarching objective is to improve security for investors and enhance supervision of the capital market, to liberalise the exchange industry and make it more competitive. The EU regulations include MiFID1, which took effect in 2007, and EMIR2, effective as of August 2012. The European exchange industry will soon be largely impacted by MiFID II, which is now expected to take effect in January 2018 following transposition to national law and enactment of implementing regulations. The new legislation includes MiFID II and MiFIR. The Regulation defines among others the requirements for the publication of data on pre/post-trade transparency and exemptions from the publication obligation. MiFID II modifies the detailed requirements for the provision of investment services, the organisational requirements for investment firms and trading systems, providers of market data services, and access rights of supervision authorities.
Competition of financial instrument trading venues has largely increased as a result of on-going liberalisation of the exchange industry over the past few years. Operators of regulated markets compete for new issuers, investors, liquidity and trade. Another challenge for exchanges is posed by OTC markets3 and multilateral trading facilities (MTF). They offer trade in the same stocks as those listed on traditional exchanges combined with very short lead times for the execution of orders as well as low trading fees. Some MTFs have been licensed as exchanges. MTFs established under MiFID after 2008 accounted for more than 31% of European trade in equities on the electronic order book in 2015.
[1] Directive 2004/39/EC of the European Parliament and of the Council of 21 April 2004 on markets in financial instruments (Markets in Financial Instruments Directive)
[2] Regulation of the European Parliament and of the Council (EU) No 648/2012 of 4 July 2012 on OTC derivatives, central counterparties and trade repositories (European Market Infrastructure Regulation)
[3] OTC (over the counter) market, where trade is made directly between market participants without the mediation of a securities exchange
Comparison of trade in shares in Europe on exchanges and MTFs4 (EUR trillion)
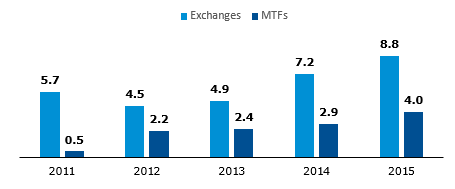
Source: FESE
IPO Market
According to the IPO Watch Europe report, the total value of initial public offerings (IPO) in Europe was EUR 57.4 billion in 2015, representing an increase of nearly 16% year on year. The IPO market was the strongest since the global financial crisis began. There were 364 IPOs in Europe in 2015, a moderate decrease year on year (376 IPOs in 2014). The biggest number of IPOs took place on the London Stock Exchange, which also boasted the highest value of IPOs (92 IPOs in an aggregate amount of EUR 16.4 billion). The second largest value of IPOs took place on the Spanish stock exchange (24 IPOs in an aggregate amount of EUR 7.8 billion). Europe’s second market by the number of IPOs in 2015 was the Swedish exchange operated by Nasdaq: 72 IPOs in an aggregate amount of EUR 5.2 billion. It was followed closely by GPW, which has for years been a top European exchange by the number of IPOs.
There were 33 IPOs on GPW in 2015 (including 14 IPOs on the Main Market and 19 IPOs on NewConnect), representing a moderate decrease year on year (down by 2 IPOs). The aggregate value of IPOs was EUR 440 million, an increase of EUR 127 million year on year, mainly driven by successful IPOs early in the year. The biggest IPOs in Warsaw in 2015 included the IPOs of Uniwheels (EUR 126 million), Wirtualna Polska (EUR 74 million) and Idea Bank (EUR 62 million). The size of the IPOs in Warsaw in 2015 reflected the specificity of the Polish market dominated by small and medium-sized companies. In previous years, GPW ranked higher in the IPO Watch report in view of large privatisation offerings on the exchange.
Capitalisation of Stock Markets
The activity of investors on the GPW markets in 2015 was largely impacted by the difficult and very demanding market environment, as demonstrated mainly by a sharp decrease of the capitalisation of GPW listed domestic companies. Their capitalisation dropped by PLN 74.4 billion, or 12.6%, year on year. The biggest year-on-year decrease of capitalisation on GPW was reported in the banking sector (down by PLN 54.9 billion), the energy industry (down by PLN 22.1 billion), and the insurance sector (down by PLN 12.6 billion). The biggest increase of capitalisation in 2015 was reported by the fuel industry (up by PLN 14.0 billion).
The capitalisation of European exchanges was PLN 12.3 trillion at the end of 2015 (source: FESE, LSEG), representing an increase of 1.7% year on year. The biggest European exchanges (LSE, Euronext, Deutsche Boerse, SIX Swiss and NASDAQ) saw an increase in the capitalisation of listed domestic companies by several or a dozen percent. The capitalisation decreased on the stock exchanges in Madrid (down by 12.2% YoY) and Istanbul (down by 18.5%).
Change in capitalisation of domestic companies on European exchanges in 2015

Source: FESE (based on EUR data), LSEG
The total capitalisation of all stock exchanges around the world decreased in 2015 for the first time since 2011 to US$ 67.0 trillion at the end of 2015 (a decrease of 1.3% year on year; source: WFE). The biggest decrease of capitalisation by 7.7% YoY was reported on American exchanges whose share in the total capitalisation of the global exchanges was 41.7% at the end of 2015. Exchanges in Asia and the Pacific reported an increase of capitalisation to US$ 23.1 trillion at the end of 2015 (up by 9.8% YoY). The world’s biggest exchange was NYSE with a capitalisation of domestic companies at US$ 17.8 trillion at the end of 2015, followed by NASDAQ (capitalisation at US$ 7.3 trillion), the Japan Stock Exchange (US$ 4.9 trillion), Shanghai SE (US$ 4.5 trillion), Shenzen SE (US$ 3.6 trillion) and Euronext (US$ 3.3 trillion).
Equity Trade
According to WFE, the total value of trading in shares of domestic companies on the Electronic Order Book was US$ 113.7 trillion globally in 2015, an increase of 40.6% year on year, mainly driven by a sharp increase in the value of trading on Asian stock exchanges (up by 126.9%). American exchanges also reported year-on-year growth (up by 5.6%).
The value of trade in shares on the Electronic Order Book on European exchanges was EUR 8.8 trillion in 2015, an increase of 21.4% year on year. Compared to other trading venues, GPW reported a moderate decrease year on year, mainly due to a relatively sharp decrease of the capitalisation of listed companies compared to other European exchanges.
Change of the value of trade in shares on European exchanges and MTFs in 2015
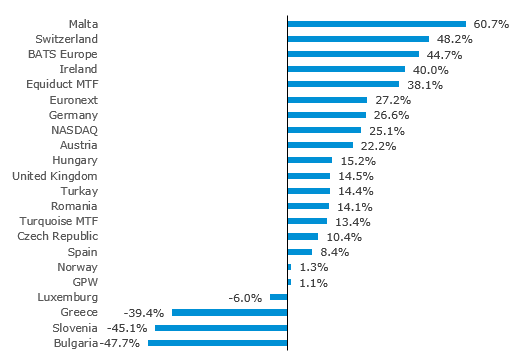
Source: FESE (based on EUR data), LSEG